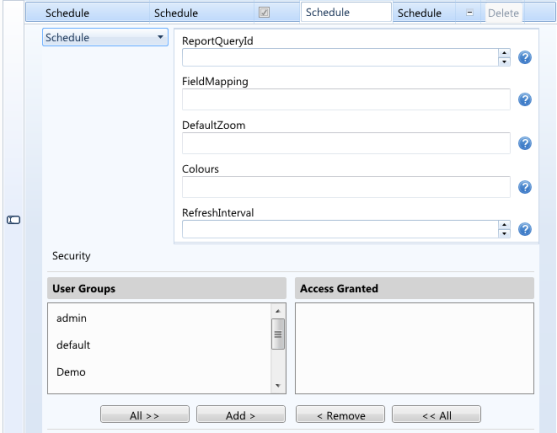
This page type is used to display a graphical breakdown of a selected report query represented as an interactive time line.
The table below list the fields for Schedule pages.
| Fields | Description |
|---|---|
|
Colours |
The schedule status colour mappings. This is where the category values are mapped to the required colours. |
|
FieldMapping |
The Report Query fields mappings. This is where the relevant report query fields are mapped to the Resource, Category,Start, End and Subject for the schedule. |
|
Default Zoom |
The schedule default zoom level. This is where the default zoom level is set to either; Hour, Day, Week, Month or Year. |
|
ReportQueryId |
The Id of the Report Query used to extract the data. |
| RefreshInterval | The number of seconds between the view automatically refreshing. Set to 0 when automatic refreshing not required. |
Note: Field labels highlighted as bold must have a value entered or selected as they are mandatory.